To test this, I decided to break up each class year into subpopulations based on their 3PFGA/FGA, referred to from this point forward as 3PA%. First, I decided I needed a prior distribution for 3PA%. Players with low shot totals in general would tend to gravitate towards the extremes, and needed to be regressed towards the average 3PA%. I won't bore you with those graphs, but depending on the class year, the α and β were around 1 and 2. About what I expected, a mean of .33 and a very flat distribution from 0->1.
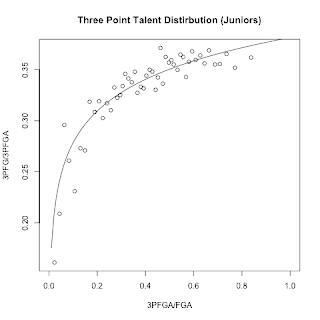
Once I had that, I created posteriors for each player by adding their 3PAs and 2PAs to the prior α and β. Then, I split each class year into subpopulations based on those posterior estimates of mean 3PA%. I ran a Gibbs sample on each subpopulation, found the α and β for each one, and graphed the mean, α/(α+ β). That resulted in the following:
As you can see, I fitted a logarithmic curve, and then used that curve to find my new beta parameters for each individual player based on their 3PFGA%. That way, three point snipers who take the majority of their shots from deep get treated as part of one population, while guys who barely take any threes at all are treated as part of another distribution. I then reexamined my plots from last time, but using the new curves as priors.
That looks worlds better than before. There's significantly less difference between the expected three point shooting and the actual three point shooting, and the number of shots taken marches right in lock step with how good we expect the player to be. In addition, there's much more granularity in being able to spot good shooters from bad, the distribution of talent is much wider, especially for upperclassmen. It's still not perfect, the extremes need some work, especially on the low end, as all of the bad shooters were better than projected, often more than 2SD better. Perhaps this is due to overfitting the curve, while a logarithmic fit looks good, I'm not sure it's actually the right one. For one thing, the limit of log(x) as x->0 is -∞. This obviously doesn't make any sense whatsoever for three point percentage, which can only be in the range of (0,1). While no players have a posterior 3PA% that results in a negative prior mean 3P%, it does serve as a warning that a logarithmic fit isn't actually how talent is distributed in real life. I played around with a few other fits, and while some resulted in a more accurate projection for the bottom quartile, the top quartile, which takes many more shots, was projected less accurately. Perhaps a piecewise fit would be best, something to look at in the future.


No comments:
Post a Comment